Why
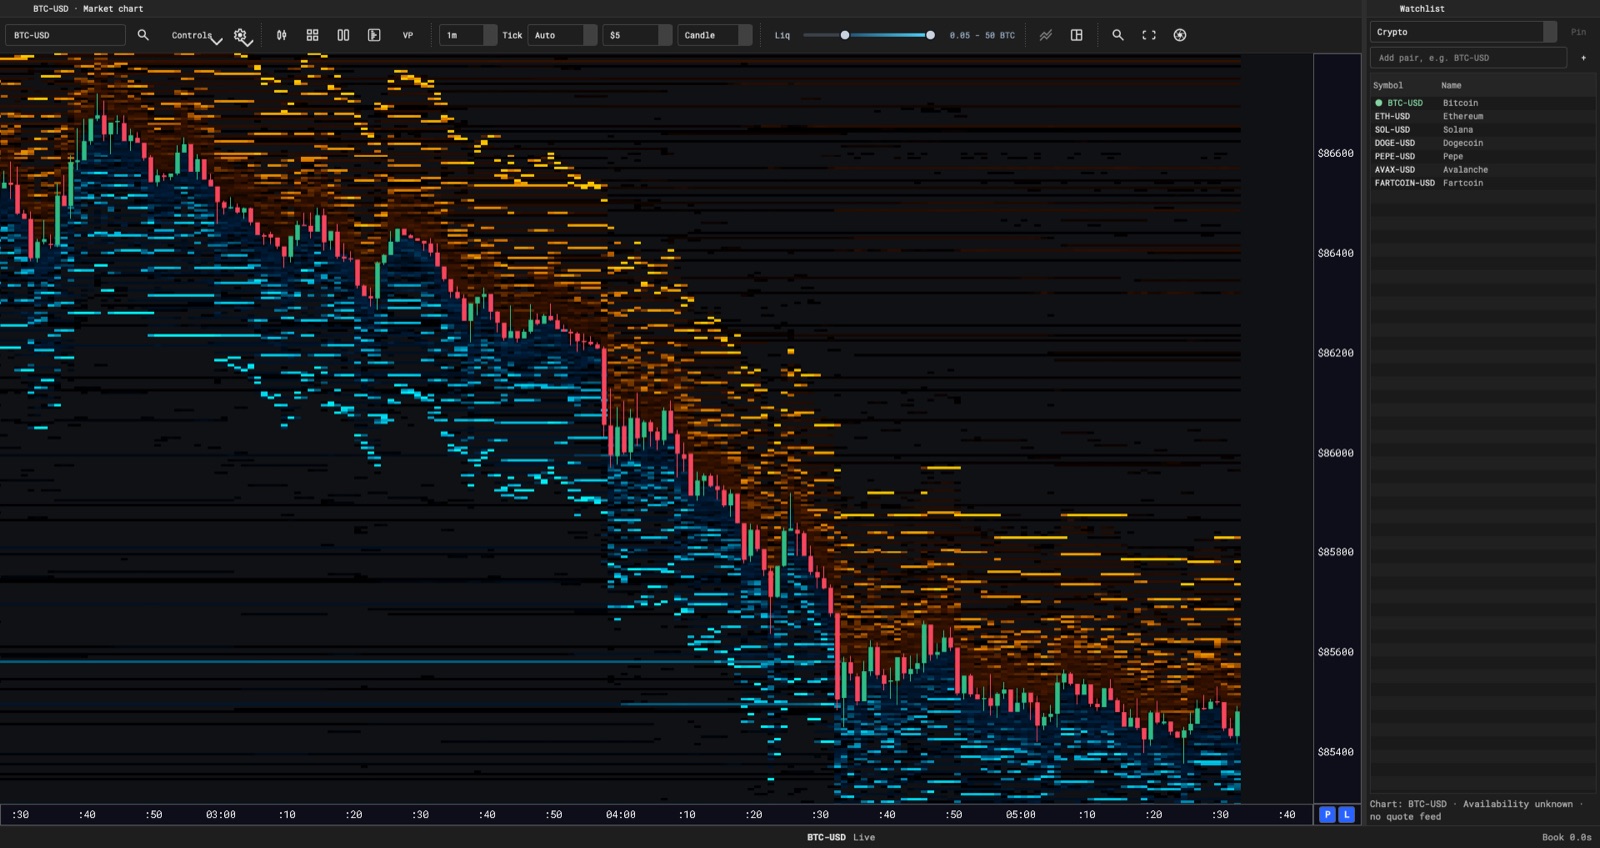
The terminals that show you this view charge hundreds of dollars a month, and the recorded data never touches your disk. I wanted the same instrument on my own hardware with the whole data path under my control. So I built it, and it is free. The server records Coinbase level 2 data into a journal you own; the client draws it.
What’s inside
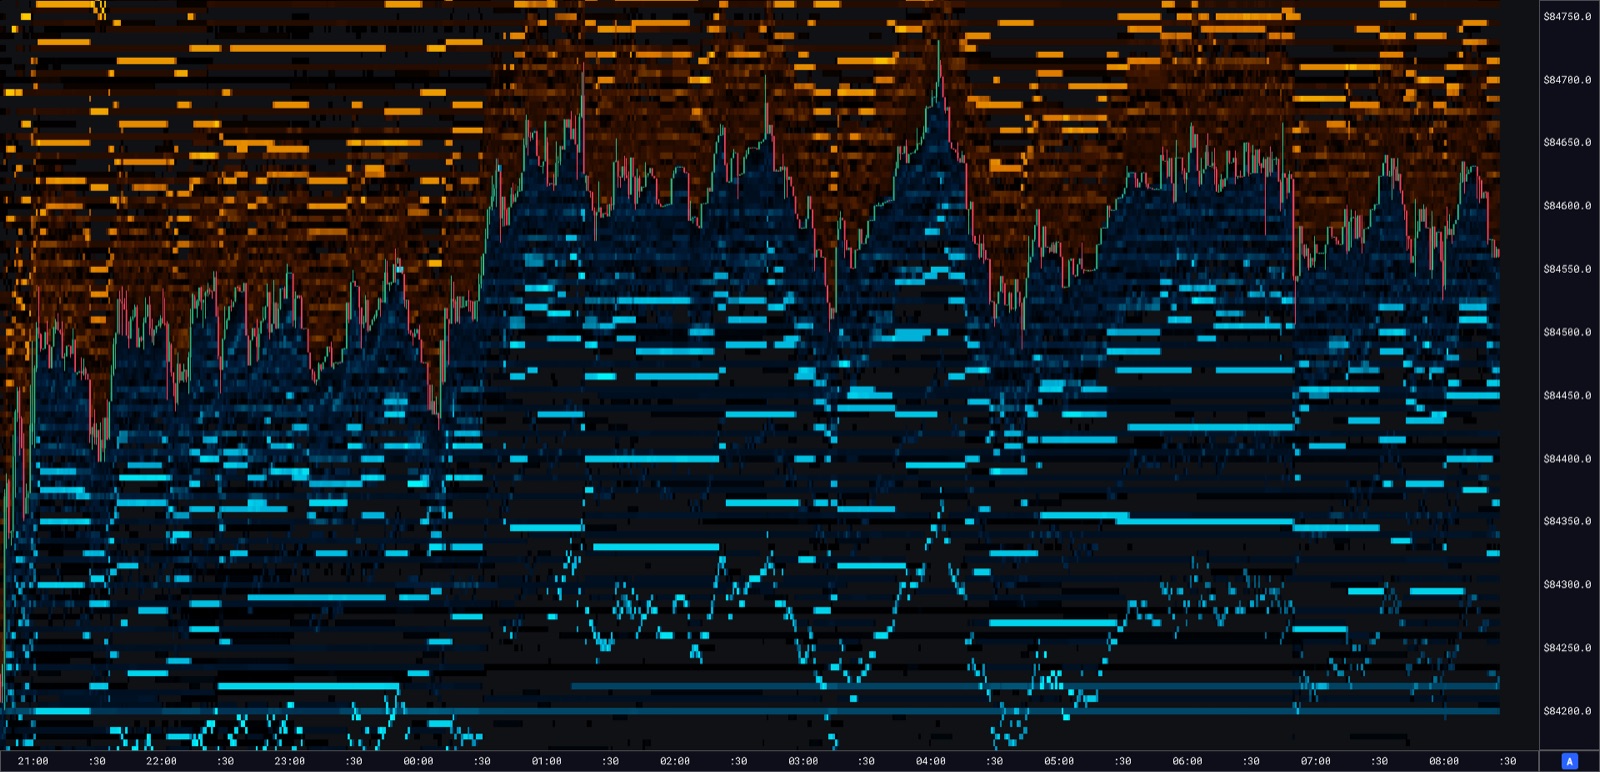
- The order book as a GPU heatmap, binned on the GPU at the chart’s tick size. Recorded history on the left, the live edge on the right, one time axis.
- Candle, hollow and line chart modes, trade bubbles, and a liquidity range slider labelled in asset or USD units.
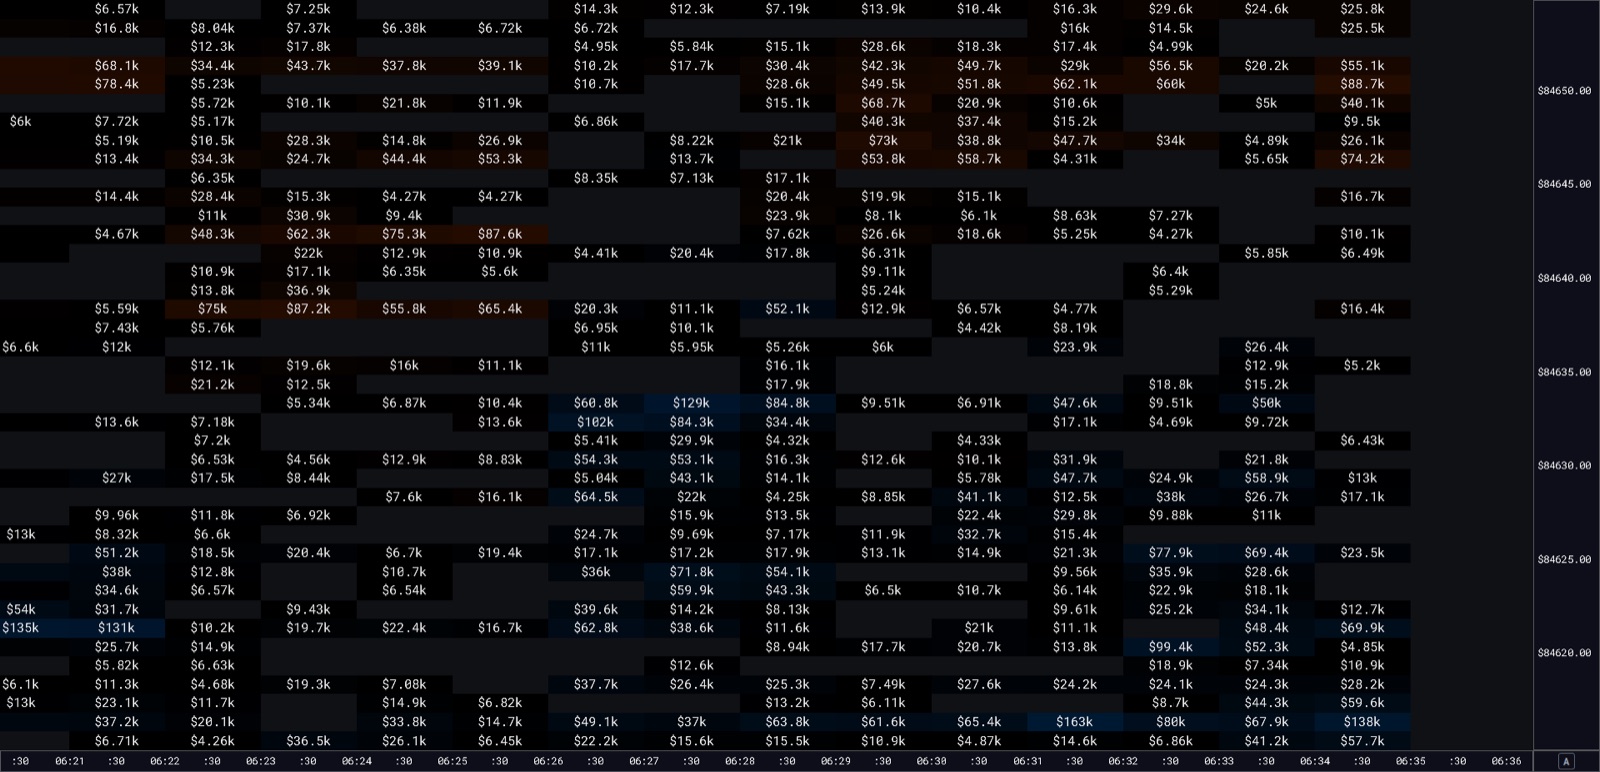
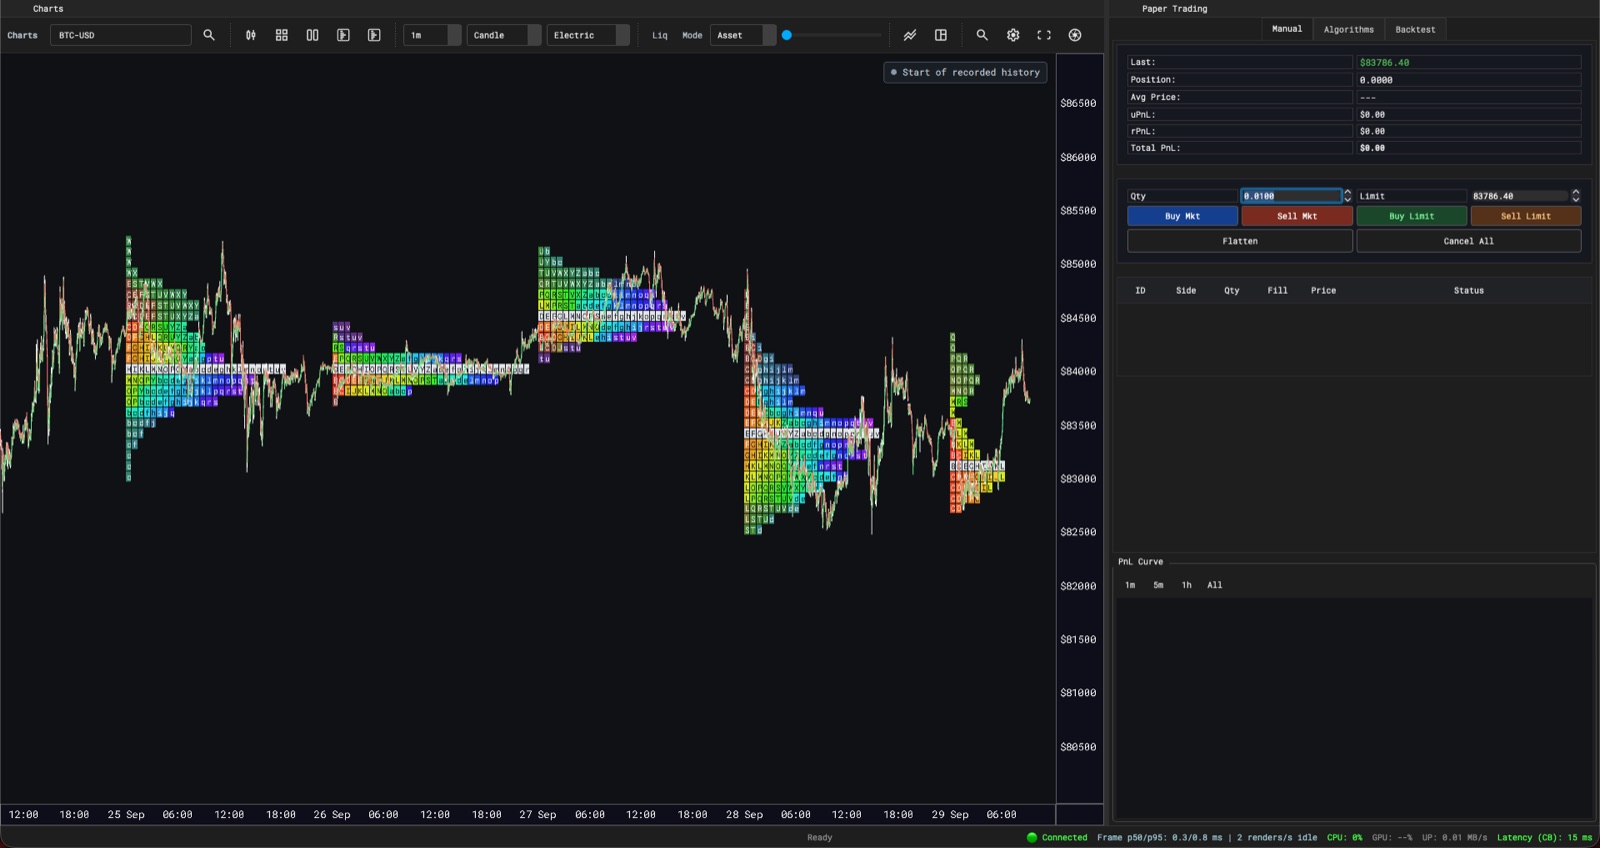
- Footprint, TPO and volume profile layers from the chart toolbar. Zoom the footprint in and every cell becomes its dollar size.
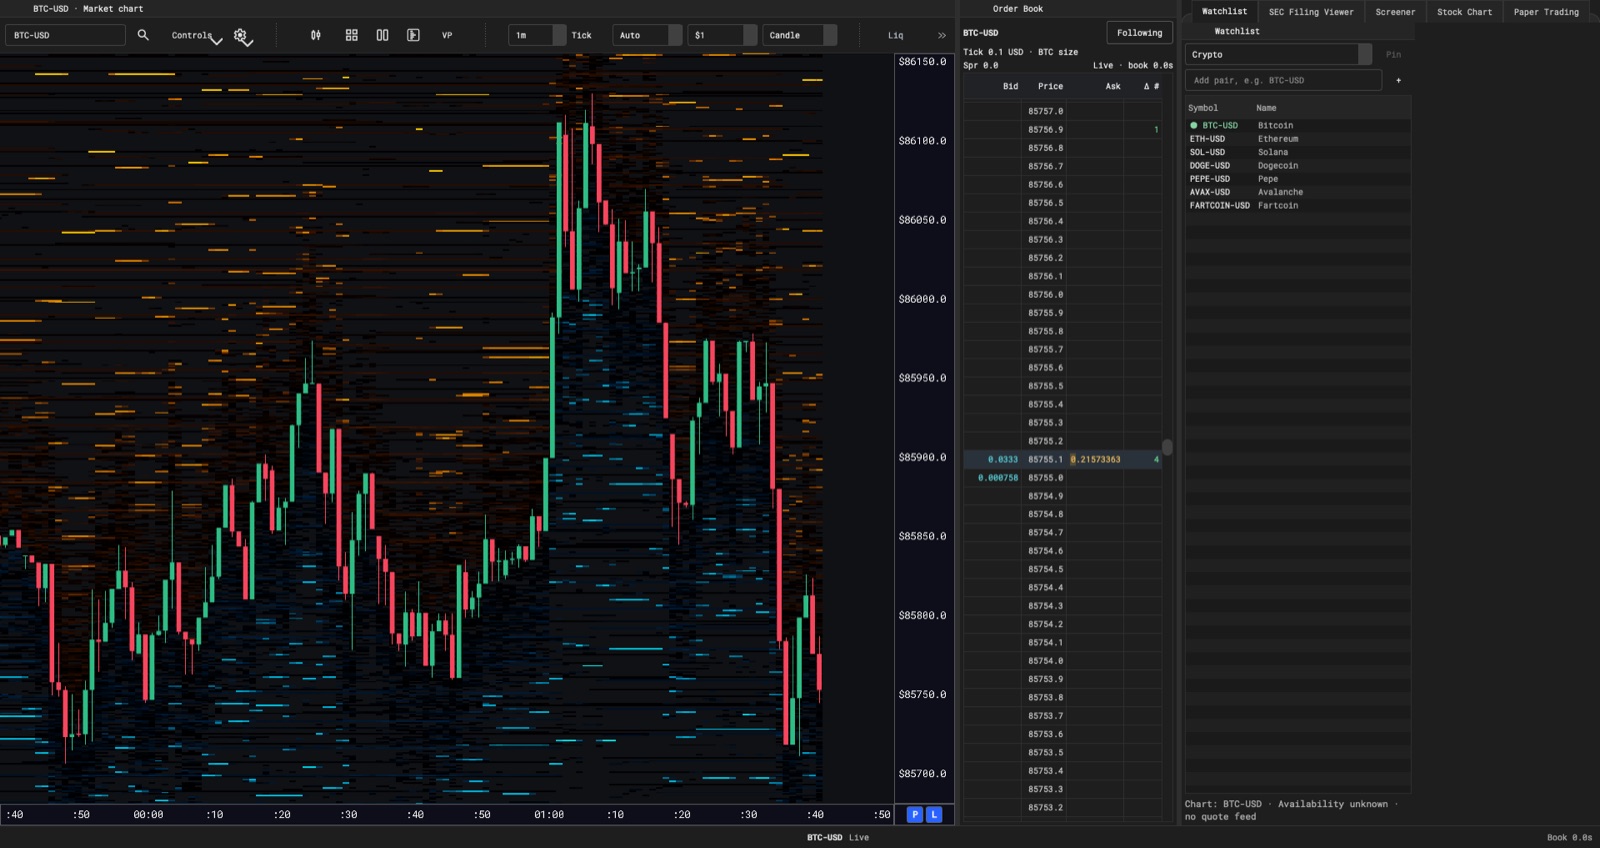
- An order book ladder dock, watchlists, and a screener dock.
- A stock chart dock with SEC Form 4 insider transactions overlaid, fed by CopeTech-Edgar.
- Paper trading on the server: market and limit orders, positions, PnL, take-profit and stop-loss brackets, hotkeys. A market-making algo runs in paper mode and a backtester replays recorded trade logs. No real orders, ever.
How it’s built
Client and server are split over a custom stream protocol on WebSocket with TLS. The server owns the exchange connection, recording, heatmap history and paper trading, and binds to localhost by default. The client owns the GPU. Heatmap, ladder and chart layers render through Qt’s scene graph with their own pipeline, so the view stays at frame rate while the feed handler is busy.
Two small tools sit beside the main binary: sentinel-capture records a raw Coinbase level 2 journal, and sentinel-roll builds heatmap history from it. Python helpers fetch candles, screener data and SEC filings.
Status
Active and in daily use. Builds on macOS, Windows and Linux. Coinbase is the only venue so far; multi-venue aggregation is on the list. There is no hosted demo and there will not be one, because it is a native app. The stills on this page are the demo.
Get it
Clone it, build it with CMake and vcpkg, generate a local cert, start the server, then the client. The README covers each step. Public Coinbase data needs no API key.